


Operating an aerial imagery service as a drone services business means dealing with clients or colleagues with diverse requirements, expectations and use cases. To ensure effective communication and set realistic expectations, it's crucial to understand the types of digital photogrammetry available in a fast and affordable manner. In this article, we'll provide an overview of the various aerial imagery outputs and what they entail, including how the final output appears. By the end of this article, you'll be able to confidently answer client inquiries such as, "Can you provide a digital representation of the elevation at each point of my work site?" If you're curious about the answer, read on to learn more!
.png)
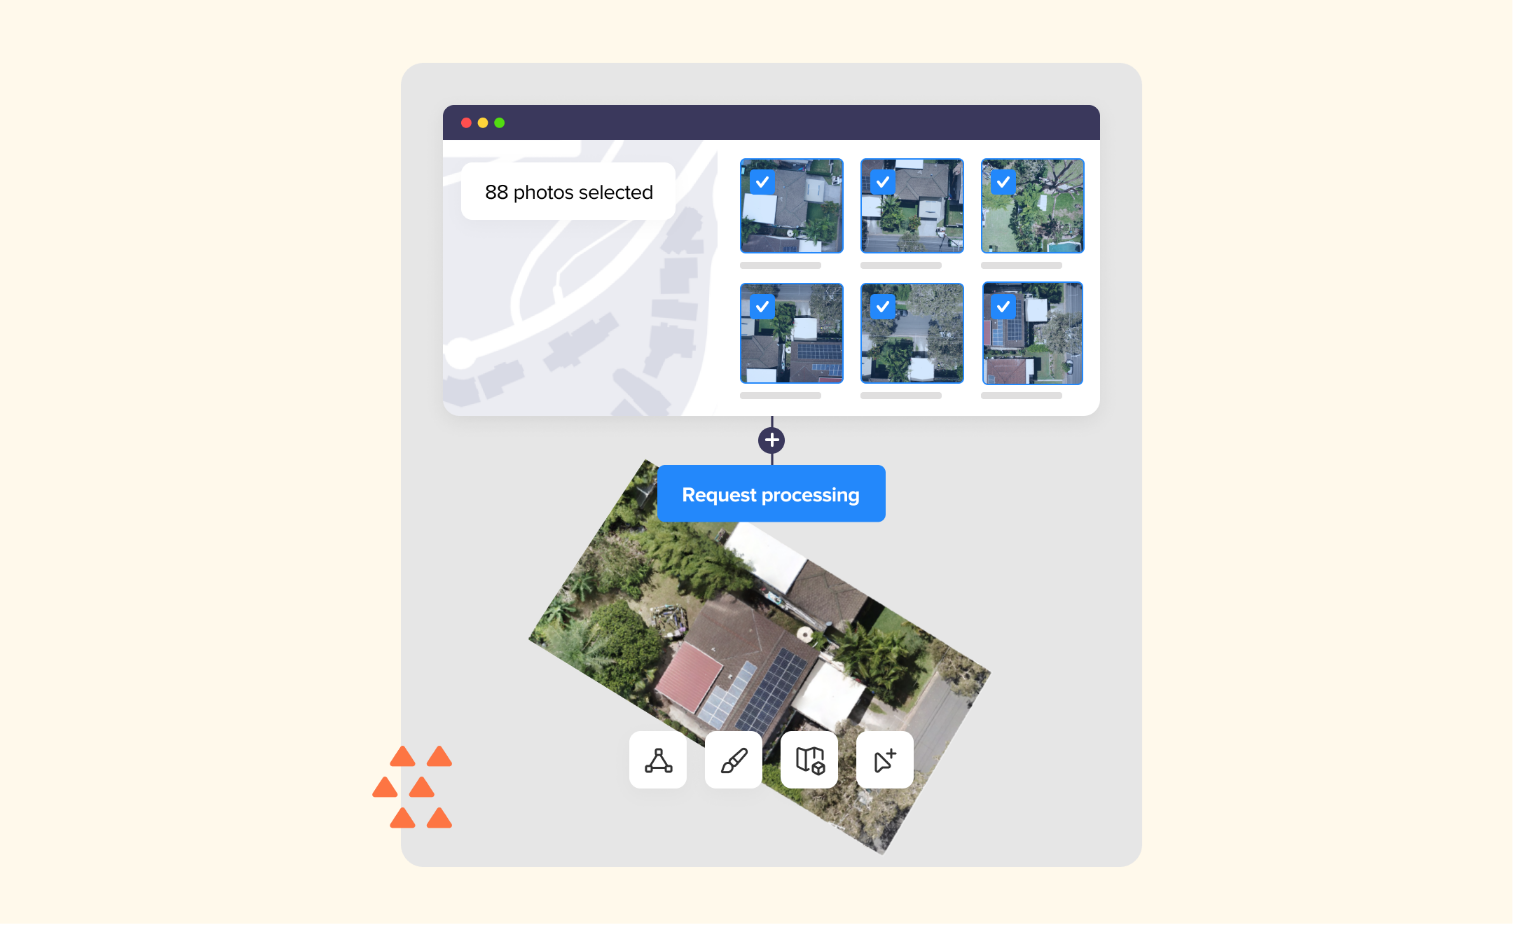
The orthomosaic output of an orthophoto is a high-resolution, geo-referenced image that is created by combining multiple overlapping aerial or satellite images of the same area or region. The process involves correcting for geometric distortions caused by terrain relief, camera angle, and other factors, to produce a seamless and accurate 2D map-like representation of the earth's surface.
The orthomosaic output is created by stitching together the overlapping images using specialised software, which takes into account the position, altitude, and orientation of the camera or satellite when each image was captured. The resulting orthomosaic image has a higher spatial resolution and more accurate geometry than any of the individual input images, and it can be used for various applications such as land-use mapping, monitoring crop growth, and infrastructure planning.
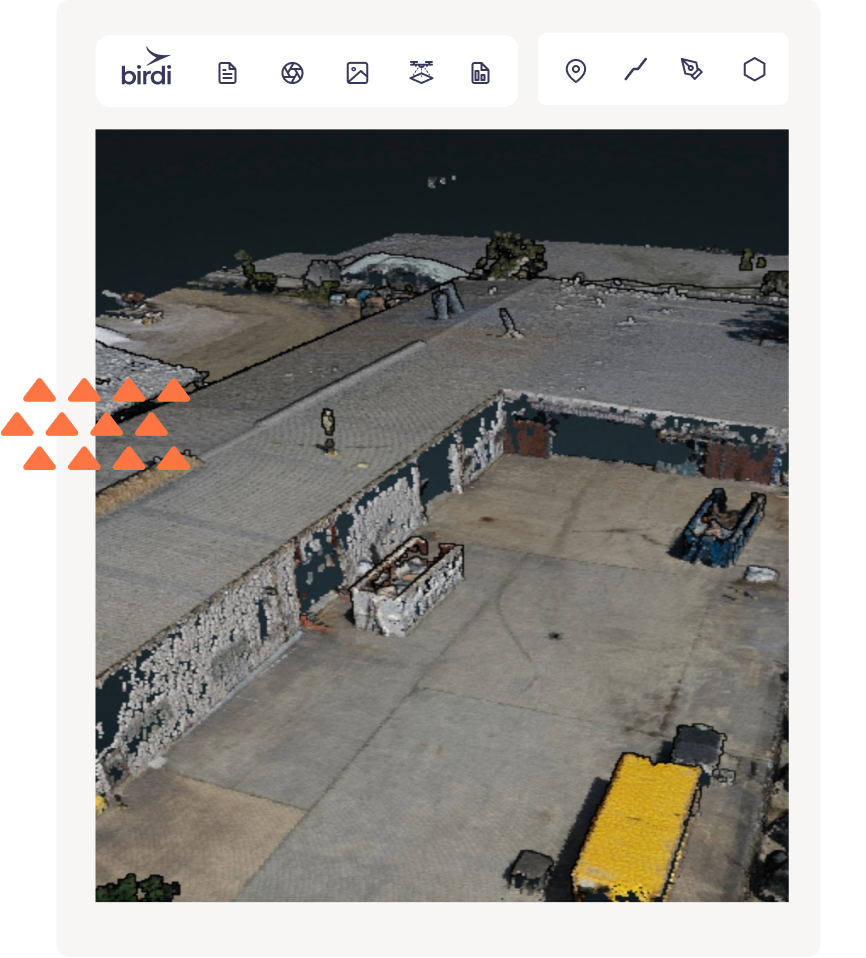
A point cloud is a set of data points in three-dimensional space that represent the geometry of an object or scene. Each point in the cloud has an X, Y, and Z coordinate, which can be used to reconstruct a 3D model of the scene.
While an orthophoto is a 2D representation, it can be used to generate a point cloud through a process called photogrammetry. In photogrammetry, multiple images of the same area are analysed to extract 3D information about the scene, such as the height and location of individual features. This data can then be used to generate a point cloud representation of the area, with each point corresponding to a specific location in 3D space.
.png)
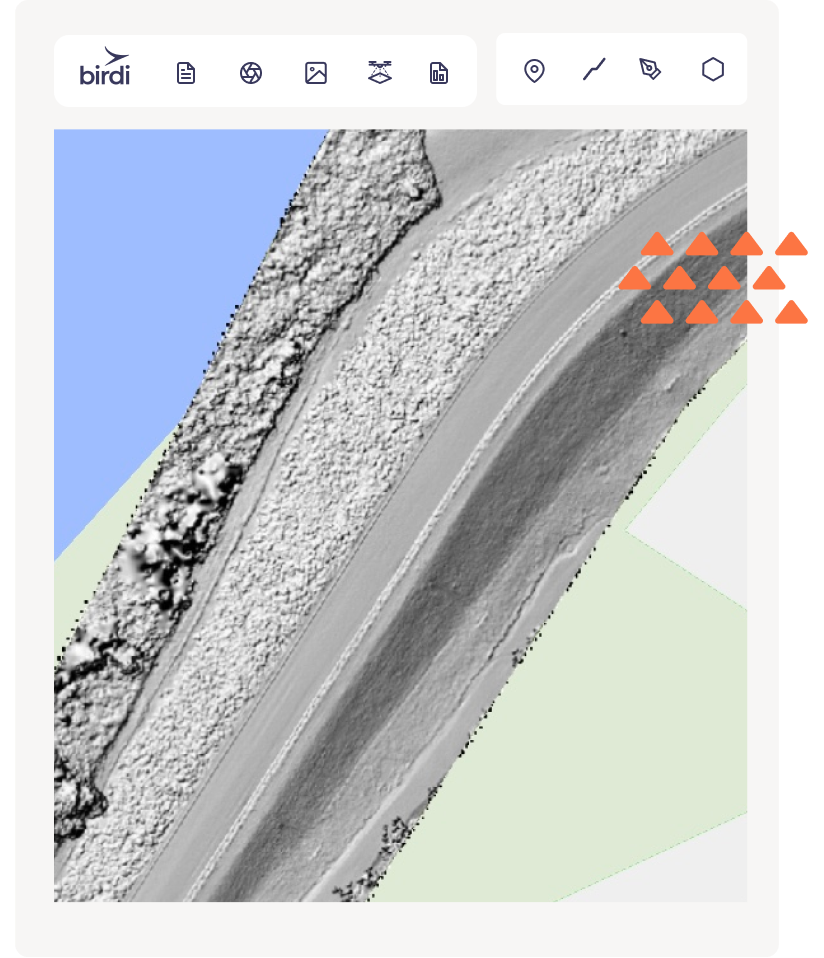
A digital surface model (DSM) is a type of 3D model that represents the Earth's surface and features such as buildings, trees, and other objects as a set of elevation values. A DSM is derived from a collection of aerial or satellite images that have been captured by drones.
To create a DSM, Birdi's photogrammetry functionality processes the images and uses algorithms to generate a 3D point cloud, which represents the X, Y, and Z coordinates of the Earth's surface. From this point cloud, the software can then create a DSM, which is a continuous raster dataset that shows the height of the surface at each location.
DSMs can be used in a variety of applications, including urban planning, forestry management, and flood modelling. By using DSMs, it is possible to create accurate 3D models of the Earth's surface, which can be used to visualise and analyse data in a way that is not possible with 2D maps or images.
DTM (Digital Terrain Model) is a type of digital photogrammetry and is a digital representation of the bare earth surface, without any objects such as trees, buildings, or other structures. The DTM represents the elevation values of the terrain surface and, provides accurate information about the topography of the area.
DTMs are created by using specialised software to interpolate the elevation values from the input data of drone aerial photos. If the drone is fitted with LiDAR (Light detection and ranging (lidar) data, this can be used for DTMs also. The output is typically in the form of a raster dataset, where each cell represents a small area on the surface of the terrain, and its value indicates the elevation of that area.
DTM is typically used in a variety of applications such as 3D modelling, land surveying, flood modelling, urban planning, and more.
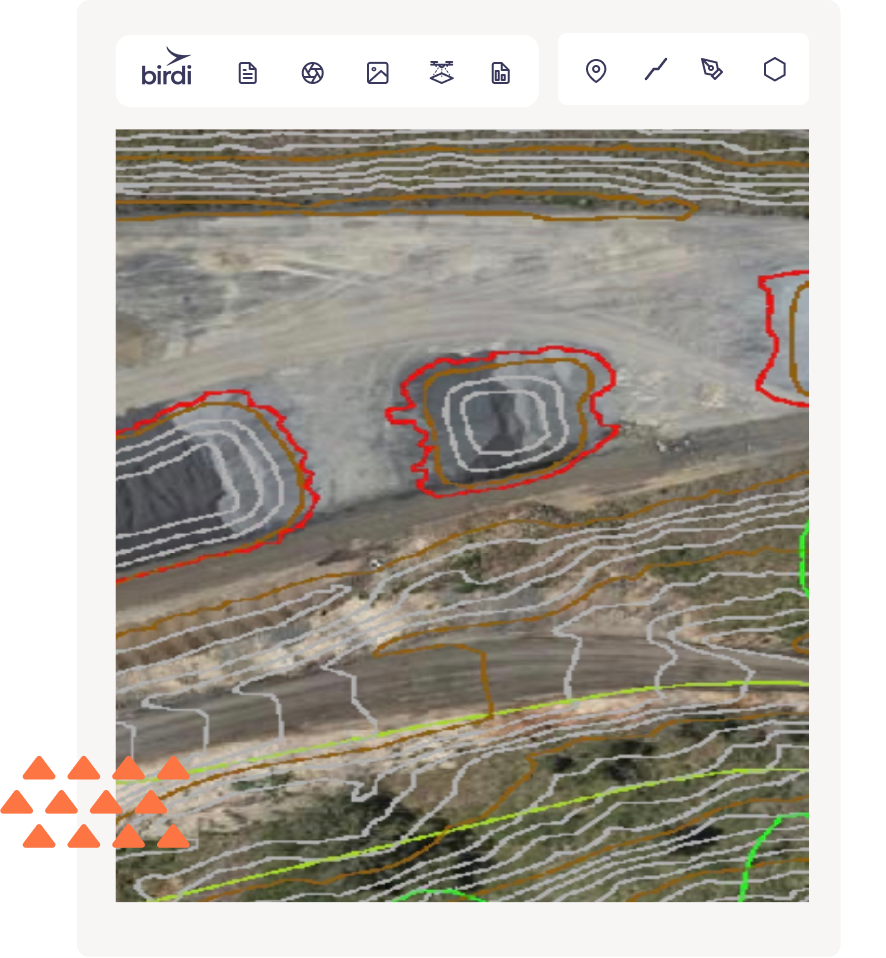
The output of aerial imagery processing known as terrain contours is a graphical representation of the terrain's shape and elevation in the form of contour lines. Contour lines are lines that connect points of equal elevation, and they provide valuable information about the shape and topography of the terrain.
In aerial imagery processing, terrain contours are generated by analysing the digital elevation data obtained from aerial photographs or LiDAR (Light Detection and Ranging) data. The elevation data is processed using specialised software that creates a continuous surface model, from which the contour lines can be extracted.
The terrain contours provide valuable information about the slope and shape of the terrain, which is essential for a variety of applications, including urban planning, civil engineering, natural resource management, and more. They can also be used to create 3D terrain models, which are useful for visualising and analysing the terrain in greater detail.
In addition to providing information about the terrain, contour lines are also used to create topographic maps, which are commonly used for navigation, hiking, and other outdoor activities. The maps show the contour lines in relation to each other and provide a clear picture of the terrain's shape and elevation.
This is a simple one - no. All of the above outputs are available from the data derived from images captured by a drone. But, the quality and accuracy of your processed output depends on how the mission is captured, carefully planning the flight path using planning software, and optimizing the overlap and sidelap between the images to ensure complete coverage of the survey area. In addition, the altitude and speed of the drone must also be taken into account to ensure that the images are captured at the appropriate resolution and with adequate detail.
To improve accuracy even further, the use of Ground Control Points (GCPs) and/or Real-Time Kinematic (RTK) can be employed (RTK processing is available on our Team and Enterprise plans; GCPs on our Enterprise plan).
The basic process includes:
You can get processing now with a Birdi free or team plan - it’s fast and affordable.
Join 1,000’s of your peers and subscribe to Birdi’s newsletter today!