Make maps for anything

Get the visibility you need of the places that matter to you.
Vertical canary arrow

Instead of making assumptions about your sites without proper visibility, get the geospatial insights you need with Birdi.

Visualize your structures and spaces with Birdi
Ocean arrow right

Visualize your structures and spaces

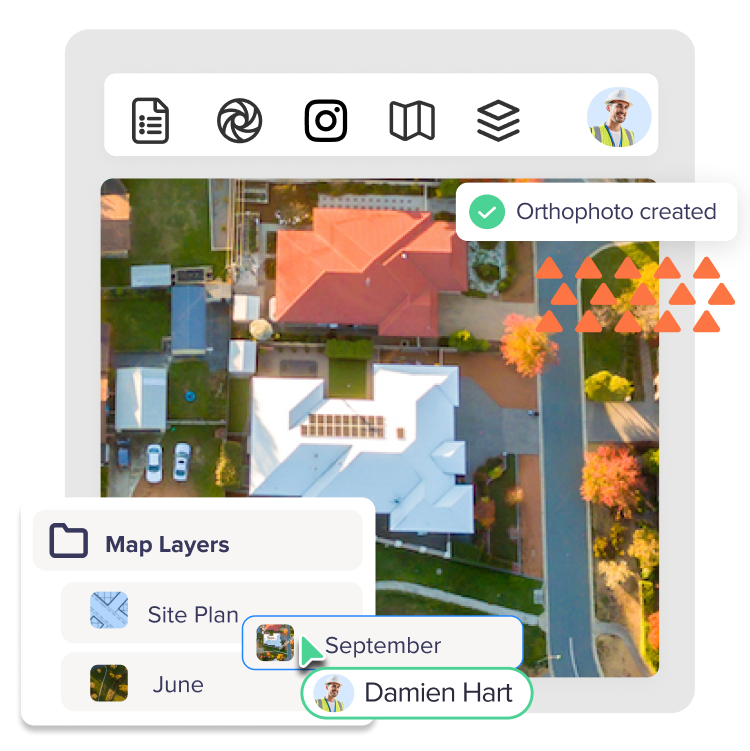
Generate 2D and 3D maps and models directly within Birdi or upload your own. Get an enhanced understanding of your structures and spaces, identify defects, assess structural integrity, measure distances, assess stockpiles and more.

Use maps for planning and development

Having an accurate and up-to-date view of sites and locations from above ensures accurate planning.

Fora arrow left
Use maps for planning and development with Birdi
Get the visibility you need to make decisions with Birdi
Midnight arrow right

Get the visibility you need to make decisions

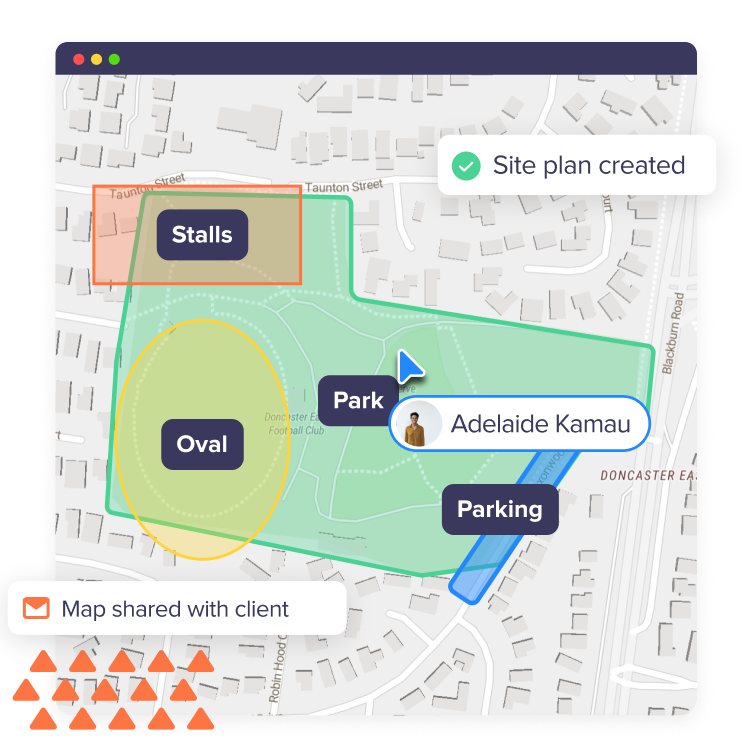
Whether you need oversight of construction progress, mine site stockpile tracking, traffic flow analysis or environmental monitoring, aerial visibility through up-to-date maps helps you to make important decisions.

Track and measure changes from above

With Birdi, compare maps over time to observe and measure changes in the landscape, site builds or structural integrity of buildings.

Sun conure arrow left
Track and measure changes from above with Birdi

Explore how Birdi solves common challenges

The pain points we hear
How Birdi solves them
Green tick icon
User-friendly design
Green tick icon
Compatibility with various data formats (CSV, GeoTIFF, Shapefiles, Pointcloud LAS and more) for seamless data import
Green tick icon
Enables 2D and 3D map creation
Green tick icon
Has interactive map layers such as markers, shapes, and annotations
Green tick icon
Enables overlay of multiple datasets for comparative analysis
Green tick icon
Tools for spatial analysis, such as distance measurement, spatial queries, and heat mapping
Green tick icon
Advanced filtering options to refine and focus on specific data subsets
Green tick icon
Advanced filtering options to refine and focus on specific data subsets
How Birdi solves them
Green tick icon
Enhanced user authentication
Green tick icon
Enables visualization of all geospatial data sets on a single map
Green tick icon
Ensures compatibility with spatial data standards (e.g., GeoJSON, Shapefile)
Green tick icon
Enables import and export of various geospatial data formats
Green tick icon
ISO 9001 and ISO 27001 certified
How Birdi solves them
Green tick icon
Allows user to organize map layers easily
Green tick icon
Allows users to import custom overlays, existing geoTIFF’s and shapefiles
Green tick icon
Supports the use of annotations (e.g., markers, polygons)
Green tick icon
Allow users to customize annotation labels
Green tick icon
Allows users to share and collaborate on map templates with their team
How Birdi solves them
Green tick icon
Real-time updates on the map
Green tick icon
Creating maps with layers that change in real-time
Green tick icon
Allows multiple users to collaboratively edit and update maps in real-time
Green tick icon
Enables notification of users when updates are made to a map
How Birdi solves them
Green tick icon
Enables teams to store maps and associated data in a single workspace
Green tick icon
Scalable cloud infrastructure to ensure accessibility and accommodate growing data volumes
Green tick icon
Compatible with major web browsers for seamless access
Green tick icon
Enables users to share maps publicly or privately with specific collaborators
Green tick icon
Allows users to set permissions when sharing maps, specifying who can view, edit, or comment
Green tick icon
Accessible knowledge base of how-to guides and tutorials for users to learn how to share and access maps
How Birdi solves them
Green tick icon
Allows multiple users to edit and update maps simultaneously in real-time
Green tick icon
Displays cursor indicators to show when other users are actively collaborating on the map
Green tick icon
Enables users to create workspaces to collectively work on map projects
Green tick icon
Enables users to mark up maps with annotation tools for shared discussion and insights
Green tick icon
Specific permissions (view, edit, share) based on user roles

A plan to suit your business size

Sole traders
Birdi Plus plan icon
Plus
$60
per month (billed annually)
plus PAYG processing
For individuals who want to brand their business, request PAYG processing, and share visualizations and insights with their clients.
1 user.
Get Access
Small teams
Birdi Growth plan icon
Growth
$120
per month (billed annually)
plus PAYG processing
For small teams looking to visualize ground & aerial data, and collaborate with stakeholders.
3+ users.
Book a Demo
Mid to large businesses
Birdi Ultimate plan
Ultimate
Let’s Talk
per month (billed annually)
Processing included
For mid to large organizations looking to scale and optimize their digital capture and embed multi-unit workflows.
As many users as needed.
Book a Demo

Some of our customers